

Argentina’s peanut industry runs almost entirely through one province, Córdoba, and within it, through a handful of towns – General Deheza and General Cabrera chief among them. For thirty years, growers there have been dealing with a fungus called Thecaphora frezzii, better known as peanut smut. It’s now considered the biggest disease threat the industry faces. A recent synthesis of 26 field studies, covering more than 900 measurements taken between 2021 and 2025, set out to answer a simple but important question: exactly how much peanut smut yield loss occurs in the field, and does that cost change depending on how good or bad the field is to begin with?
Thecaphora frezzii: Meet the Fungus Hiding in Córdoba Soil
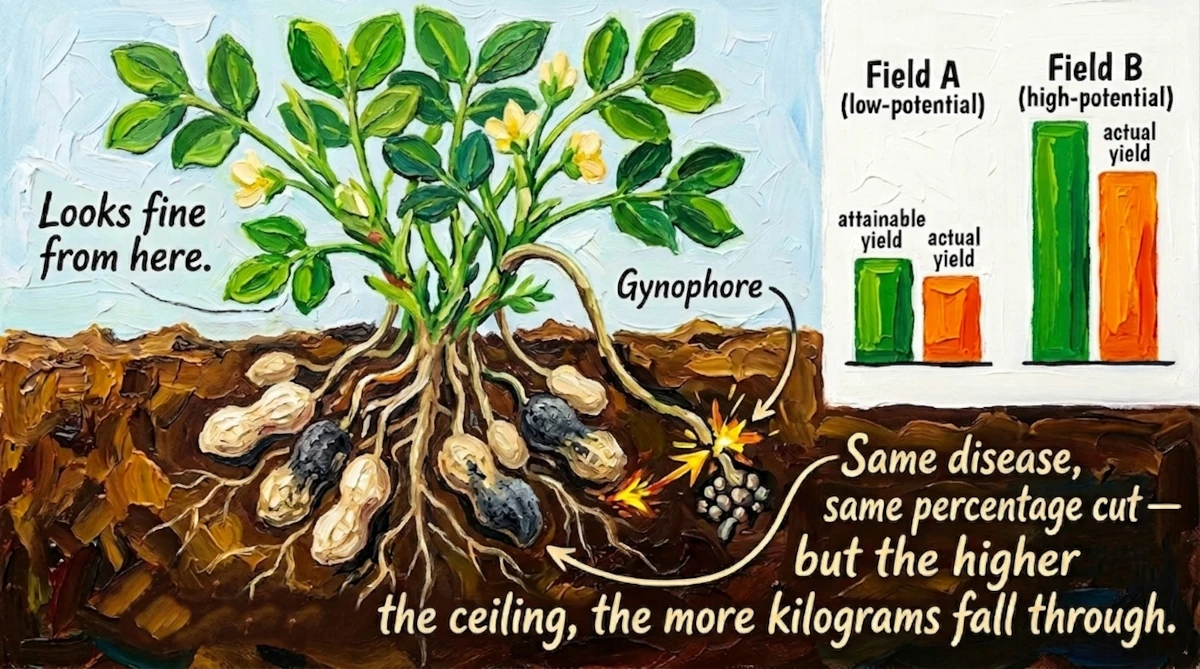
Thecaphora frezzii was first confirmed in commercial fields in 1995, and spends most of its life waiting. It survives in the soil as teliospores – hardy spores that can remain viable for years, long after a peanut crop has been rotated out. The moment it’s been waiting for comes after flowering, when the peanut plant sends a fertilized stem, the gynophore (called the clavo, or peg, in Argentina), down into the soil to form a pod. Chemicals released by the peg as it burrows in are enough to trigger nearby teliospores to germinate. The fungus then gets into the developing pod and takes it over, turning what should be a healthy kernel into a mass of dark spores, sometimes swelling the pod into an abnormal shape in the process.
None of this is visible from above ground. The plant’s leaves and stems look completely normal. That’s part of why the disease has been so hard to manage – there’s no scouting for it in the usual sense. Finding out how bad an infection is means digging up plants and cracking open pods by hand.
Since that first detection in 1995, the fungus has spread to the point where essentially every field in Córdoba now carries it – 100% prevalence, reached within about 15 years.
Peanut Smut Incidence vs Severity: Why Incidence Wins
Plant pathologists typically track disease two ways:
- Incidence – what share of pods are infected, expressed as a percentage.
- Severity – how badly each infected pod is damaged, usually scored 0 (healthy) through 4 (kernel completely destroyed).
You’d think severity would give the fuller picture. But in this case, the two turn out to move almost in lockstep: about 80% of infected pods land in the worst severity category regardless. Once smut gets into a pod, it tends to finish the job. That means incidence alone – a much faster, simpler measurement to collect – does almost as good a job predicting yield loss as the more detailed severity scoring would. This is the main reason incidence became the metric of choice for the entire analysis, and it’s also the metric you’ll use yourself in the practical guide below.
Peanut Smut Yield Loss: 0.8% Per 1% Incidence [24-29 kg/ha]
The researchers tested four different statistical models to calculate how yield responds to rising incidence – a basic regression, an average across individual study regressions, a random-effects meta-analysis, and a mixed-effects model. Despite using different methods, all four landed in a tight cluster:
- Yield lost per 1% rise in incidence: 24.2 to 28.7 kg per hectare
- Share of potential yield lost per 1% rise in incidence: 0.74% to 0.87% (roughly 0.8% on average)
Scaled up, a 10-percentage-point jump in incidence – for instance, from 10% infected pods to 20% – costs a field somewhere in the range of 240 to 290 kg/ha, or about 7-9% of what that field could otherwise have produced.
A worked example makes it concrete: a field capable of yielding 4,000 kg/ha, sitting at 20% incidence, would be expected to lose about 640 kg/ha to smut alone.
Baseline Yield Swings Wildly. The Damage Rate Doesn’t.
The study draws a sharp line between two concepts that are easy to conflate:
- Attainable yield – what a field could produce with essentially no disease pressure, driven by soil, weather, and management. Across the studies, this ranged enormously, from 1,370 kg/ha in the weakest environments to 5,409 kg/ha in the strongest.
- Damage coefficient – the rate at which smut eats into whatever that potential happens to be.
The surprising and genuinely useful result is that while attainable yield varies field to field and year to year, the damage coefficient barely budges. A top-performing field doesn’t get treated any more gently by the fungus, proportionally speaking, than a struggling one. Because the percentage loss is constant, the absolute kilogram loss is actually larger on better land – meaning the highest-potential fields have the most to lose in raw tonnage, even though the percentage hit is the same everywhere.
12% Breakpoint Debunked: No Safe Zone for Peanut Smut
Early plots of the pooled data seemed to show something highly counter-intuitive: yield actually appeared to rise as incidence went from 0% up to about 12%, before dropping off sharply after that point. A model built around that bend actually explained more of the variation in the data (R² of 0.37) than a simple straight line did (R² of 0.29), which made it tempting to treat 12% as some kind of biological tolerance threshold.
It didn’t hold up. When the team dug into why the bend appeared, they found it was a byproduct of mixing data from very different environments – fields with high attainable yields tended to also have lower measured incidence in the dataset, and lower-yielding fields tended to have higher incidence. Stacked together, that created the illusion of a curve that didn’t exist within any single environment.
Three separate checks confirmed the relationship is actually linear throughout:
- Rescaling every study’s yield to a common 0-100% “relative yield” basis made the loss curves for low- and high-incidence environments overlap almost exactly.
- Testing incidence level as a moderating variable showed no meaningful difference in the loss rate (p = 0.91).
- The relative damage coefficient stayed inside the same 0.74-0.87% band no matter which yield class was examined.
The takeaway: there’s no safe zone. Smut starts costing yield at the very first percentage point of infection and keeps taking a steady cut all the way up – there’s no plateau growers can count on at low disease levels.
Turning This Into Field Decisions
A few practical implications fall out of the data:
- Pod counts are enough. Because incidence predicts loss almost as well as detailed severity scoring, growers and consultants don’t need labor-intensive lab assessments to get a reliable read on economic impact.
- Losses are now calculable. Take a field’s realistic attainable yield, multiply by its measured incidence and the ~0.8% relative damage coefficient, and you get a defensible loss estimate – useful for budgeting, insurance conversations, or evaluating whether a management change paid for itself.
- The best fields carry the biggest stakes. Since the percentage loss is fixed but kilogram losses scale with yield potential, protecting high-performing land from smut has the largest dollar impact.
- Don’t wait for a threshold. The data rules out the idea that low incidence is harmless – every additional percentage point of infection matters from the outset.
Peanut Smut Yield Calculator: 8 Steps to Measure Loss in Your Field
You don’t need a lab to get a useful estimate of how much smut is costing you. Here’s how to do it yourself, using the damage coefficient established above.
Step 1: Time it right
Wait until pods are mature, close to harvest. You can’t judge infection accurately earlier, and you can’t see it at all from outside the plant.
Step 2: Dig, don’t scout
Pull up a representative sample of plants from the field. This is destructive – the plants you sample won’t go on to be harvested normally – but it’s the only way to see inside the pods.
Step 3: Open the pods and just count infected vs. not
Check a decent-sized sample (more pods = a more reliable number). For each one, note whether it’s infected – look for kernels replaced by dark, powdery masses, and pods that look swollen or misshapen. You don’t need to score the fine-grained 0-4 severity scale; since roughly 80% of infected pods are a total loss anyway, a simple yes/no count gets you almost all the useful information, much faster.
Step 4: Calculate your incidence
Incidence (%) = (infected pods ÷ total pods checked) × 100
Example: 25 infected out of 150 checked → 25 ÷ 150 × 100 = 16.7% incidence.
Step 5: Know your field’s disease-free potential
This is roughly what the field would yield with zero disease – a multi-year historical average for that specific field, adjusted for this season’s conditions, is a reasonable estimate.
Step 6: Estimate the percentage of yield you’re losing
Estimated loss (%) = Incidence (%) × 0.8
Example: 16.7% × 0.8 ≈ 13.4% of potential yield lost.
Step 7: Convert to kilograms per hectare
Loss (kg/ha) = Attainable yield (kg/ha) × Estimated loss (%)
Example, on a field with a 3,800 kg/ha potential: 3,800 × 0.134 ≈ 509 kg/ha lost.
Shortcut: you can also estimate loss directly with Incidence (%) × ~26.5 = kg/ha lost, which for 16.7% incidence gives about 442 kg/ha – close to the figure above, with the small gap reflecting normal variation between methods.
Step 8: Break it down by zone
If parts of your farm have noticeably different soil or yield history, run the calculation separately for each rather than using one farm-wide average – since the disease-free potential (not the damage rate) is what varies most from place to place. Remember, too, that this linear relationship was confirmed across incidence levels from under 1% up to nearly 85%, but hasn’t been tested beyond that range, so treat estimates at the very extreme end with some caution.
Quick reference
| Incidence level | Roughly this much yield lost | On a 3,800 kg/ha field |
| 5% | ~4% | ~150 kg/ha |
| 15% | ~12% | ~460 kg/ha |
| 25% | ~20% | ~760 kg/ha |
| 50% | ~40% | ~1,520 kg/ha |
Bottom Line
Thecaphora frezzii is dangerous largely because it’s invisible – it does all its damage underground, in a pod, where nobody’s looking until harvest. What this synthesis provides is a way to see it anyway: a stable, well-supported number showing that roughly 0.8% of a field’s potential yield disappears for every 1% of pods that turn out to be infected, no matter how good or bad that field was to start with. That consistency is what makes this disease newly manageable – not because it’s gotten any easier to stop, but because it’s finally become possible to measure, predict, and plan around it in the field, with nothing more than a shovel and a notebook.
Think you’ve mastered it? Test yourself with the 5-question quiz below – it only takes a minute.
Quiz: Can You Calculate a Peanut Farmer’s Real Losses?

Source
Study: Yield losses associated with peanut smut incidence in Argentina: a quantitative synthesis across field studies
Authors: Luis I. Cazón, Noelia R. González, Emerson M. Del Ponte, Ana C. C. de Carvalho, Florencia Asinari, Boris X. Camiletti, Juan A. Paredes (2026)
Read the full paper: https://www.biorxiv.org/content/10.64898/2026.08.11.744131v1





Leave a Reply