

Genomes from 44 cats point to a species that has long lived small, with no clear sign of inbreeding. Whether that holds is another matter.
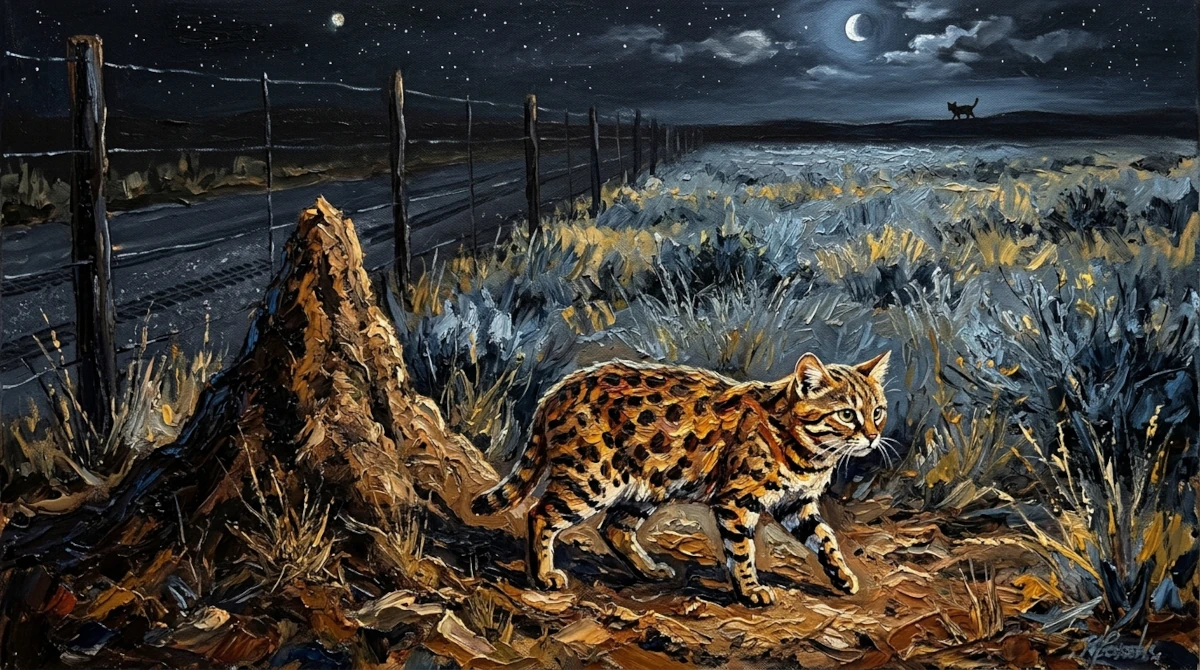
Picture a cat the size of a large kitten, creeping through the dry grass of southern Africa at night. It weighs one to two kilograms. It is also, by most accounts, among the most successful hunters of all the wild cats on the continent, making a kill in roughly 60% of its hunts. Lions are commonly put at about 25%.
Yet we know remarkably little about it. It lives only in South Africa, Namibia, and Botswana, the most restricted range of any African cat. It is solitary and nocturnal, and even at peak estimated densities it reaches only about three cats per hundred square kilometers. The IUCN lists it as Vulnerable, but its most recent assessment noted data gaps, including a lack of systematic surveys across the range.
A new study of black-footed cat genetics offers some of that missing data. A Stanford-led team sequenced the genomes of 44 cats from across the species’ range and read its history in its DNA. It is the first genomic study of free-roaming black-footed cats; an earlier genome study, published in 2024, relied on zoo and museum animals, some of unknown origin. Its results complicate a common assumption, that low genetic variation means inbreeding.
A Backup Plan That Doesn’t Work
For many endangered species, zoos serve as an insurance policy. For this cat, the policy has largely failed. Wild black-footed cats live five to six years, but captive ones live only two to five, and many die of systemic amyloidosis, a disease in which abnormal protein builds up in organs such as the kidneys.
So the species’ future rests in the wild, where documented dangers are mostly human-made: trapping, poisons meant for larger predators that the cats also eat, and habitat degraded by livestock farming. Roads and expanding farmland add to the pressure, and climate change is expected to worsen it.
How the Black-Footed Cat Genetics Study Was Done
A new reference genome. To compare cats with one another, the team first needed a reference: a complete, well-ordered genome to line everyone else’s DNA up against. They built one from a free-roaming male from South Africa. It is organized into 19 chromosomes (18 plus the X) that match the domestic cat’s layout, and it captured more than 94% of a standard checklist of genes expected in meat-eating mammals, a sign that it is nearly complete. The team also dealt with a known trap in cats: pieces of mitochondrial DNA (the DNA of the cell’s energy-producing structures), known as NUMTs, that were copied into the main genome long ago. Software can mistake these copies for real genetic variation, so the team assembled the true mitochondrial genome separately and removed the stray copies.
Cats from across time. The 44 genomes include 27 modern animals, sampled over roughly the past 20 years: blood from radio-collared cats at Benfontein (South Africa), hair from Grünau (Namibia), and tissue from road-killed animals in the Northern Cape. The other 17 came from museum and private collections, with specimens dating as far back as 1818.
Old DNA is fragile and chemically damaged, so the team used extraction and library methods designed for ancient DNA, then checked for the telltale damage that can mimic real variation and found no sign it was skewing the results. They also trimmed samples to matching coverage for key comparisons, so a high-quality modern genome wouldn’t be treated differently from a patchy century-old one. Even so, the type of sample left a technical fingerprint in some analyses, so modern and historical cats were analyzed separately where it mattered.
One more thing to keep in mind: several of the headline analyses rest on very few animals. The inbreeding test used four high-coverage modern genomes, all from two South African sites, and the population-history analysis used one cat each from Botswana, Namibia, and South Africa.
Finding One: Little Variation, but No Clear Sign of Inbreeding
Black-footed cats have very little genetic variation: about 0.0004 differences per DNA letter between two random genomes, or roughly four per ten thousand letters. That is lower than in lions or tigers, and consistent with an earlier study of zoo and museum cats.
Low variation is often read as a sign of inbreeding, but the two are not the same thing. Low variation can simply mean a population has been small for a long time. Inbreeding means relatives have recently been mating, and it leaves a specific mark: their young inherit long, identical stretches of DNA from both parents (called runs of homozygosity). Recombination breaks these stretches up over generations, so long ones point to recent inbreeding. In the four best-quality modern genomes, stretches longer than 3 million letters were very rare. Shorter ones did appear, which fits a small population over a long time.
Two limits apply. Only four genomes were good enough for this test, all from South Africa, and the museum specimens were too low-quality to test, so the result says nothing about whether inbreeding was a problem in the 1800s. The authors also speculate that living small for so long may have weeded out some of the most harmful mutations, which would make inbreeding less damaging, but this was not tested.
Finding Two: Small for a Very Long Time
To find out why variation is low, the researchers reconstructed past population sizes with two methods, one for the deep past and one for recent generations.
Deep history. Looking back over the past 2,000 to 100,000 years, the cats’ numbers appear to have been modest. The researchers estimate that about 11,500 cats at a time were passing on their genes. Scientists call this the effective population size. It counts only the animals that actually reproduce and contribute genes, so it is usually lower than the total number of cats alive.
That is small for a wild cat. Lions and leopards historically had effective sizes of 50,000 to 150,000. And the smaller a population, the less genetic variation it keeps, because rare gene versions are more easily lost by chance in each generation. A long history at around 11,500 would help explain why black-footed cats have so little variation today.
The cats’ numbers dipped to about 8,000 around 10,000 years ago, then rose to about 10,000 over roughly 5,000 years, possibly as the end of the last glacial period dried the region and expanded arid habitat. Further declines were inferred after that.
These estimates come from a method called PSMC, applied to one cat each from Botswana, Namibia, and South Africa. All three gave a similar picture. They depend on two assumptions, the mutation rate and a three-year generation time, and the method cannot see the last thousand years or so.
Recent generations. A second method (called GONE), applied to the South African cats, reads patterns in how genes are linked along chromosomes. It suggested about 8,000 cats roughly 100 generations ago, then a drop to about 2,800 over the last 50 generations. At about three years per generation, that is around 150 years, a timing that matches the spread of commercial farming and the decline seen in long-term monitoring at Benfontein.
A strong caution. The authors treat this result as tentative. The method needs an assumed recombination rate (how often chromosomes swap pieces when eggs and sperm are made). None has been measured for this species, so they borrowed the domestic cat’s. Small changes to that value change the answer a lot, and the range of uncertainty around the estimate is wide. The decline is best treated as a hypothesis to be tested.
Finding Three: Low Variation Doesn’t Need a Crash
The researchers then asked a direct question: is a recent crash needed to explain why variation is so low? To find out, they simulated the variation that would build up under two different histories, 150 times each, and compared the results with the real cats (about 0.00039 differences per DNA letter).
- A long, steady history. The population stays at 11,500. The simulations averaged 0.00039, a match.
- A steady history, then a crash. The population stays at 11,500, then falls to 2,800 within the last 150 generations (about 450 years). The simulations averaged 0.00038, almost identical.
The ranges around the two results overlap almost completely (95% intervals of 0.00028 to 0.00047 and 0.00017 to 0.00047), and both simulations borrowed mutation and recombination rates from the domestic cat. In other words, today’s diversity cannot tell these two histories apart.
One detail worth noting: the simulated crash begins 150 generations ago, earlier than the drop of roughly 50 generations that the second method suggested. An earlier crash has had more time to erode variation, so if even that leaves diversity unchanged, a later one of the same size would too.
Two lessons follow. First, low variation does not require a recent collapse: a long history at modest numbers is enough to produce it. Second, variation erodes slowly, over many generations, so even a real crash of this size might not show in the DNA yet. That cuts both ways. A reassuring diversity number isn’t proof that all is well, and a low one isn’t proof of disaster. The simulations show that the data fit both histories, not which one is true.
Finding Four: These Cats May Get Around
Field studies suggest these cats stay close to home: home ranges of about 10 square kilometers for females and 20 for males, and a predicted maximum dispersal of around 50 kilometers. If so, cats living hundreds of kilometers apart should look genetically distinct.
The genomes show only weak differences:
- Little difference between places. Cats from different sites differ from one another by about 0.00065 per DNA letter, which the authors describe as only slightly more than the differences between cats from the same site (about 0.0004).
- A faint link with distance. Cats farther apart tend to be a little more different, as you would expect, but the trend is weak and could be chance (correlation 0.3, p = 0.07).
- A faint split by country. A standard plot of genetic similarity separates modern cats roughly by country, but the pattern is faint.
- Mixed ancestry. Namibian cats fit a single ancestry group, while South African and Botswanan cats carry a mix of two, in both modern and historical samples. That is what you would expect if genes have moved between regions.
The authors read this as a sign that cats may be more connected than field studies assumed, though they present it as speculation. Most of the range lies over Nama Karoo and savanna, and a corridor of suitable habitat may have allowed movement between Namibia and sites farther east. An alternative is that today’s populations descend recently from a common source and simply haven’t had time to diverge. With small samples per site and approximate sampling locations, the connectivity finding is a pointer, not a measurement.
What It Could Mean for Conservation
The authors’ own conclusions are modest. The measures below follow from the findings, but only the first is spelled out in the paper.
- Add genetics to risk assessments. Effective population size, gene flow, and long homozygous stretches can complement headcounts for a species too elusive to count. The authors urge bringing genomic data into IUCN assessments.
- Protect connectivity. If the cats’ genetic health leans on movement between regions, then the roads and expanding farmland the authors flag could weaken it, which makes open rangeland and safe road crossings a logical priority.
- Reduce human-caused deaths. Poisoning, trapping, and traffic are documented causes of death, and cutting them follows directly.
- Invest in the wild. The authors note that the difficulty of keeping these cats in captivity makes conserving diversity in the wild even more crucial.
- Keep watching. Because diversity lags behind population change, repeated sampling over time would show whether long homozygous stretches begin to appear or connectivity weakens. The authors also note that analyzing the earliest specimens would be valuable if higher-quality data can be collected.
The Takeaway
The black-footed cat has probably had low genetic diversity for millennia, and for now it shows no clear sign of inbreeding, possibly helped by populations that stay more connected than field studies assumed. That is good news, but a fragile kind. The same farming, poisons, and roads that may have shrunk its numbers over the last century could cut the connections that protect it, and the evidence for that decline is still uncertain. The genome suggests the species is not in an inbreeding spiral, which gives conservationists a window to keep it that way.
Think you’ve mastered it? Test yourself with the 5-question quiz below – it only takes a minute.
Quiz: Can You Read a Black-Footed Cat’s DNA?

Source
Study: Genetic Diversity and Population Structure of the Black-Footed Cat: Insights into Felis’s Deadliest Predator
Authors: Victoria B. Grant, Kelsie Hunnicutt, Michelle Schroeder, Martina Küsters, Jonas Oppenheimer, Shreya Banerjee, John J. Baczenas, Dmitri Petrov, Jacqueline M. Bishop, Nadine Lamberski, Beryl Wilson, Alexander Sliwa, Beth Shapiro, Katherine A. Solari, Stepfanie M. Aguillón, Ellie E. Armstrong, Molly Schumer (2026)
Read the full paper: https://www.biorxiv.org/content/10.64898/2026.05.29.728895v1


Leave a Reply