

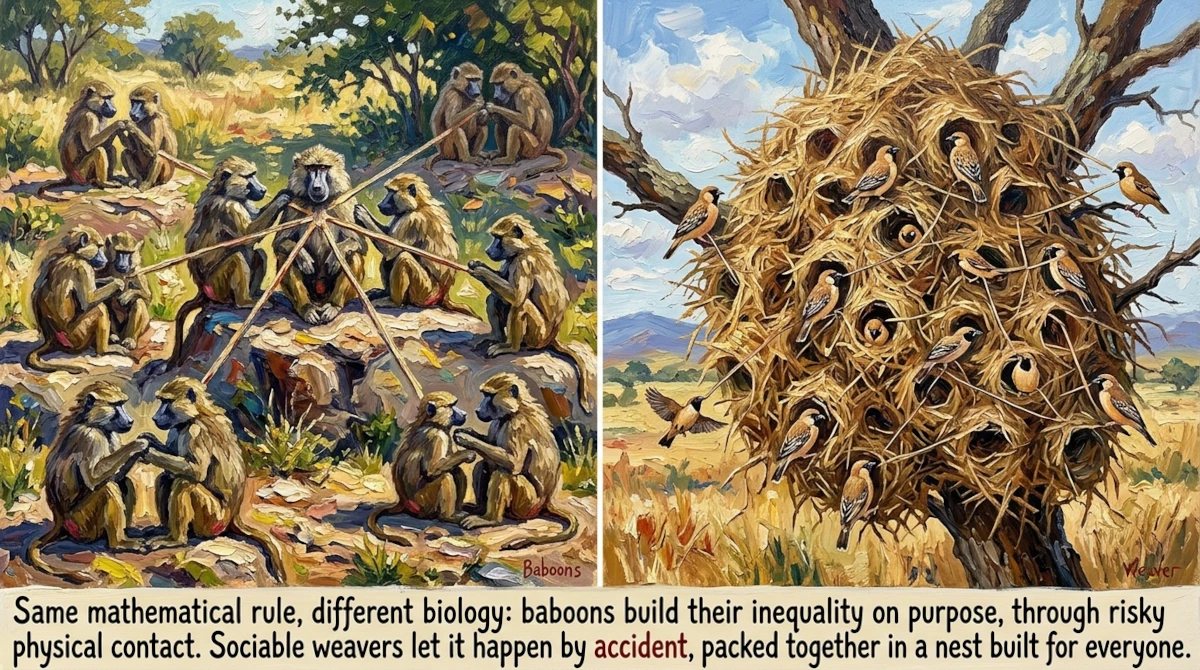
Picture a troop of baboons grooming each other in the afternoon shade, a flock of finches wheeling together at dusk, a pod of dolphins traveling as one. From the outside, these look like tight, egalitarian communities. But look closer at who is connected to whom, and a strange mathematical pattern emerges – one that also shows up in human friendships, Twitter followers, and airline route maps. It’s called the Friendship Paradox, and a sweeping analysis of 391 animal social networks across 53 vertebrate species shows it’s not just a human quirk. It’s woven into the structure of social life across the animal kingdom.
What Is the Friendship Paradox in Animals?
The Friendship Paradox says something deceptively simple: on average, your friends have more friends than you do. This isn’t a comment on your popularity – it’s math. In any real social network, a handful of individuals end up far more connected than everyone else. Because those “hub” individuals have so many connections, they show up in an outsized number of other people’s – or other animals’ – social circles. So when you average the connectedness of anyone’s social partners, the hubs drag that average upward, almost always above what the individual has themselves.
Researchers measure the strength of this effect using a metric called relationship disparity: the gap between an individual’s own number of social connections and the average number their partners have.
A quick example makes it concrete. Imagine an animal – call it D – with two social partners, C and E. C happens to be a hub with four connections; E is more modestly connected, with two. Average C and E’s connections together and you get three. Subtract D’s own count of two, and D’s relationship disparity is +1: D’s social world, on average, is more connected than D is. Do this for every individual in a network and average the results, and you get a single number describing how “lopsided” that society’s social fabric really is.
Interestingly, this isn’t just a repackaged version of other network statistics like degree heterogeneity. The researchers found relationship disparity captures something genuinely distinct – not how unequal a population is overall, but how that inequality is oriented around each individual’s own doorstep.
What Kind of Society Produces the Sharpest Inequality?
Three structural ingredients determine how strongly a network experiences the Friendship Paradox:
- How sparse the network is. This turned out to be the single strongest factor, and it works in the opposite direction you might expect: the fewer of all possible connections that actually exist, the stronger the disparity. When most animals in a group aren’t directly linked, there’s more room for a few hub individuals to tower over everyone else’s local neighborhood. Pack a network full of connections until nearly everyone is linked to everyone, and the paradox nearly disappears.
- How busy the network is, on average. Networks where individuals maintain more connections overall (a higher mean degree) tend to show stronger disparity too – more interaction gives hub-like individuals more opportunity to pull away from the pack.
- How cliquish the network is. Groups with tightly bonded subcommunities amplify the effect further. Being embedded in a cohesive clique raises the odds that at least one of your neighbors is a “bridge” figure linking your clique to the wider network – and bridges tend to be dramatically more connected than the average clique member.
Network size barely mattered, and whether relationships were measured as strong/weak bonds or simple present/absent links made little difference either. The clearest recipe for inequality: sparse, busy, clique-riddled social worlds.
It’s Not Just Physics – It’s Biology
Here’s where the story gets more interesting than pure network math. If relationship disparity were only a product of network shape, you’d expect it to look roughly similar across species once you accounted for structure. It doesn’t.
Using models that account for how species are related to one another on the evolutionary tree, the researchers found:
- 60.3% of the variation in relationship disparity traces back to species identity – something particular about how a given species organizes its social life.
- 11.7% traces back to shared ancestry (phylogeny) – related species tend to resemble one another.
- The remaining 28% is variation between different populations of the same species.
In short, more than 70% of the story is biological, not just architectural. What kind of animal you are, and where you sit on the evolutionary tree, shapes how unequal your society becomes almost as much as the raw shape of your social network does.
Mammals Play a Different Game Than Birds and Reptiles
Perhaps the most compelling finding in the research is a consistent divide between mammals and “sauropsids” – the birds and reptiles.
To test whether observed disparity reflected chance or something more deliberate, researchers compared real networks to 1,000 randomly shuffled versions of themselves, each one preserving how many connections every individual had but scrambling who was linked to whom. Networks whose real disparity diverged meaningfully from this random baseline were labeled “accentuated.”
Nearly half of all networks (47.8%) deviated significantly from chance:
- 9.7% were more unequal than random chance would predict.
- 38.1% were less unequal – individuals tended to associate with others of similar social standing, producing more level playing fields than pure randomness would generate.
But the pattern splits sharply by lineage:
Mammals told a story of deliberate social engineering. In networks built from direct physical contact – grooming, mating, fighting – disparity ran significantly higher than random chance would predict. Physical contact is risky: it can spread parasites and pathogens, or lead to injury during conflict. That cost appears to make mammals selective about who they touch, and that selectivity produces sharply uneven social worlds shaped by dominance hierarchies, kinship, and deliberate choice. Notably, when mammals interacted indirectly – just occupying the same space, without physical contact – their networks looked far more like the random baseline, reinforcing that it’s specifically the high-stakes physical interactions driving the inequality.
Sauropsids, by contrast, mostly matched what chance alone would predict, whether the interactions were direct or indirect. Bird and reptile social inequality looks less like the product of calculated social strategy and more like a simple byproduct of some individuals happening to be more sociable than others – though the researchers note this could also reflect real differences in cognitive capacity for maintaining complex, differentiated social relationships over time.
From Curiosity to Tool: Hunting for “Sensor” Animals
This is where the science turns practical. Because hub individuals are mathematically overrepresented as other animals’ social partners, you can find them without mapping an entire population – just by sampling a random animal’s partners instead of the animal itself. This “friend of a friend” approach has already proven itself in humans: sampling people’s social contacts detected flu outbreaks roughly three weeks earlier than random surveillance, and similar logic has tracked COVID-19 spread and shifting voting intentions.
But the technique’s reliability in wildlife depends entirely on the biology described above:
- It works best in sauropsid networks and mammalian indirect-association networks, where relationship disparity tracks closely with (or is weaker than) random expectations. In these flatter, less calculated social systems, a “friend of a friend” behaves like a highly reliable, mathematically predictable stand-in for a well-connected individual.
- It’s much trickier in mammalian direct-contact networks, where relationship disparity is significantly stronger than expected by chance. Because mammals make highly deliberate, selective choices about who they physically interact with, these networks are highly distorted. In these systems, the simple “friend of a friend” shortcut doesn’t add as much value on its own, and field researchers are advised to pair it with spatial, temporal, or social-role data to keep outbreak monitoring effective.
The Takeaway
Social inequality among animals isn’t random noise, and it isn’t purely a matter of geometry either. It emerges from the interplay of two forces: the raw architecture of a network – how sparse, busy, and cliquish it is – and the deep biological history of the species living within it, particularly whether their social lives are built around costly, high-stakes physical contact or looser, lower-risk association.
Next time you watch a troop of baboons grooming in the shade, the flock of finches wheeling overhead, or the dolphin pod moving as one, there’s a hidden asymmetry running through each of them – a handful of hubs, and everyone else quietly orbiting them. Mammals, it turns out, are the more calculating architects of that asymmetry; birds and reptiles let sociability sort itself out more freely. Either way, the feeling of being outshined by your own friends isn’t just in your head – it’s baked into the mathematics of being social at all.
Think you’ve mastered it? Test yourself with the 5-question quiz below – it only takes a minute.
Quiz: Do You Know Why Your Friends Have More Friends Than You?

Source
Study: The Friendship Paradox across animal social systems is governed by network structure and biological features
Authors: Eloise F. Newman, Sarah C.L. Knowles, Josh A. Firth (2026)
Read the full paper: https://www.biorxiv.org/content/10.64898/2026.03.24.713537v2


Leave a Reply